Choose the Best Traders Time Frame
Trading can be a bit confusing. Sometimes the market looks bad (bearish) if your traders time frame is too short, like checking every 5 minutes, but it looks good (bullish) if you look at the whole day. And then on a monthly chart, it might look like nothing’s even happening! That is why it is super necessary to choose the right traders time frame when you trade.
What matters most is this: Pick the time frame that works best for YOU—one that fits your style and helps you make smart choices. If you can find a traders time frame where you have an edge (a better chance to win), then that’s the one you should use. Understanding how to pick the ideal traders time frame will give you more control and confidence in your strategy.
What are Time Frames in Trading
Let’s break it down! A time frame is how much time each part of your trading chart covers. Your traders time frame can range from 1 day, 1 hour, or 1 minute all the way down to just a few seconds or even ticks (which show every tiny price change).
The traders time frame you pick decides how often your chart updates and shows price movements. It connects dots on a line chart or builds candlesticks (those little bars you see on trading charts) that show what happened during that time.
Most Popular Time Frames
The time frame you choose changes how you read the chart—and what patterns you notice. That’s why selecting the best traders time frame is key to reading price action with clarity and accuracy.
For example: On a 2-minute chart, you will see fast price moves and small trends. That’s great for quick trades, but it can also be noisy and hard to trust.
You can also change how far back you want to see history. A 5-minute traders time frame could show the last 200 candlesticks… or cover several days, depending on how much history you want.
How to Choose the Right Time Frame
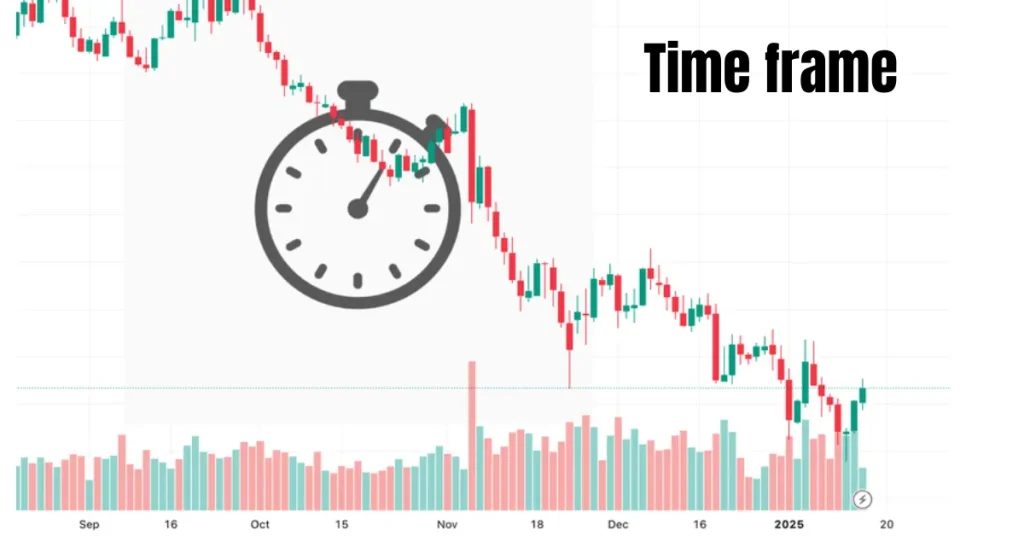
There are all kinds of time frames—some show tiny price moves, and others show big, long-term trends.
But here is the trick: you are all looking at the same market, just at different levels of detail!
Every traders time frame has strengths and weaknesses—it’s all about matching one to your personality and pace. So the best one for you depends on how you like to trade.
Here is a quick guide to help:
- Scalpers (super fast traders) use second or tick charts to catch small, quick moves.
- Day traders use minute or hourly charts to trade during the same day.
- Swing traders like daily or 4-hour charts to ride bigger trends for a few days.
- Position traders look at weekly or monthly charts and hold trades for a long time.
What Is the Best Time Frame for Day Trading?
If you prefer day trading and ending all your positions at night, then you are a day trader. Day trading typically involves working with shorter traders time frame periods, so it’s vital to pick one that suits your rhythm and responsiveness—such as minutes or hours—to watch rapid price shifts.
Some traders even check daily charts to stay aware of the bigger market trend. But not all day traders are the same. Some move slowly and carefully, while others love to make quick trades every few minutes.
For example:
- A slower day trader might watch the 15-minute or 1-hour charts.
- A moderate-speed trader will typically glance at 5-minute or 30-minute charts.
- An active trader will use a 2-minute chart and glance at the 15-minute or hourly charts.
Now, let’s talk about assets like cryptocurrencies. These can fluctuate a lot. This is why some day traders find it preferable to utilize longer short-term charts (like 15 or 30 minutes) as opposed to incredibly rapid ones. This minimizes the “market noise” and makes it simpler to spot patterns.
What Is the Best Time Frame for Scalping?
Scalping is all about speed. As a scalper, your trades can be as short as a few seconds! The concept is to gain small profits by getting in and out of the market hundreds of times throughout the day.
To do this, scalpers use the shortest time frames, like tick charts. Each tick shows just one price change. It is super detailed and fast.
Depending on your style:
- A slower scalper might use a 2-minute traders time frame, balancing detail with trade frequency. In scalping, adjusting your traders time frame to match the market’s speed is the key to staying in control.
- A moderate scalper might use a 1-minute chart and also look at the 5-minute and 4-hour charts.
- A fast scalper might use tick charts and glance at 1-minute and 15-minute charts.
Scalpers often adjust how many ticks are shown on their charts. If the market is moving super fast, they might adjust their traders time frame by increasing the tick count to slow things down. by increasing the number of ticks. If the market is moving slowly, they will speed things up by lowering the tick count to see more activity.
It is kind of like watching a YouTube video. When things are too fast, you slow them down. When it is too boring, you speed it up!
What Is the Best Time Frame for Swing Trading?
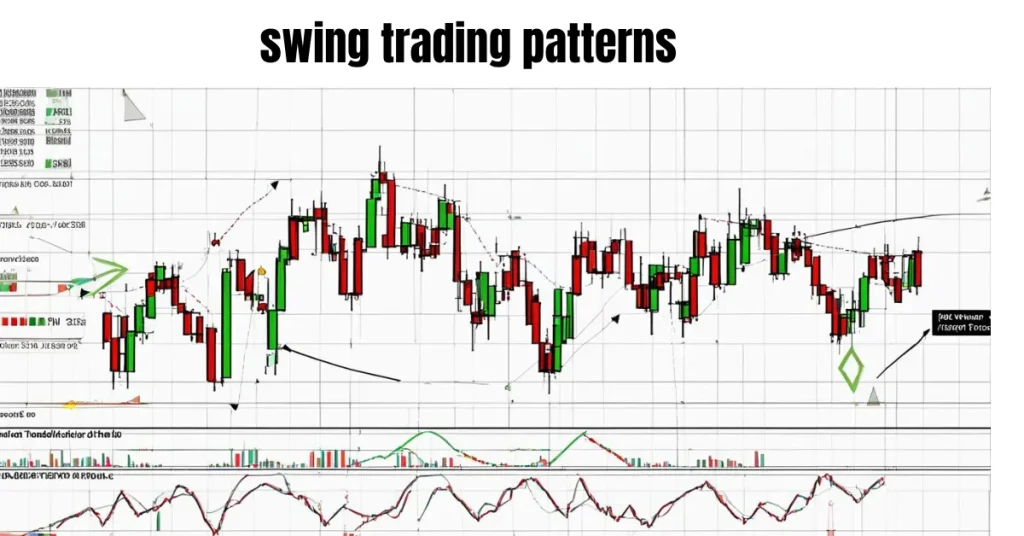
Swing trading is just keeping trades for a few days, sometimes even a week or two. You do not have to sit in front of your computer all day for this type of trading. It provides you with time to think and strategize.
Swing traders work with larger time frames:
- A swing trader who is not too tight would consider reviewing 1-hour, daily, and weekly charts.
- A moderate swing trader may view 15-minute, 4-hour, and weekly charts.
- A quick swing trader can view 5-minute, 1-hour, and weekly charts.
Since swing trading focuses on bigger moves, you don’t have to stress over every tiny price change. You can check the charts a few times a day, then go do other things.
What Is the Best Time Frame for Position Trading?
Position trading is the slowest type of trading. Here, you hold your trades for weeks or even months. You are not looking for small, quick gains—you are trying to ride the big trends.
Position traders rely on long-term traders time frame charts such as daily, weekly, and monthly views to capture big-picture trends. These charts help them spot big market trends that last a long time.
Here is how some position traders approach it:
- A slow-paced position trader might stick to daily, weekly, and monthly charts.
- A moderate one might use 1-hour charts for timing but still follow daily and monthly charts.
- A faster position trader could watch 15-minute and daily charts but make sure everything lines up with the monthly trend.
A lot of position traders also study fundamentals, like company news or economic trends. But they still use charts to decide the best time to enter or exit a trade.
Difference Between Short and Long Time Frames
Let’s compare short vs long traders time frame choices to see which best suits your trading behavior.
- Shorter time frames let you zoom in and see every small price move. They are great for spotting quick patterns but also show a lot of “noise” that can confuse you. You will probably see more trading signals, but many might be false alarms. Price can change quickly and stop you from making a trade, even if it is heading in the right direction.
- Longer time frames help you step back and focus on the bigger story. They give fewer trading signals, but these signals are usually more reliable. Since they reflect longer-term movements, you are less likely to be misled by random price jumps.
Also, short time frames feel more intense. The market moves fast, and you have to make quick decisions. You will be glued to your screen, watching every tick.
But longer time frames are slower and calmer. You have more time to think and plan. It is easier to stay cool and avoid rushed choices.
Another thing to think about is the position size.
When trading short time frames, you often deal with smaller price moves. To try to make good profits, traders sometimes use leverage (borrowing money to trade more). That adds more risk.
With longer time frames, you are aiming for bigger price swings, so you don’t need to trade as big or use much leverage. That means less risk overall.
One last tip: When you switch between different time frames, you will notice that charts can look really different. Patterns and indicators that seem strong in one time frame might look weak or even disappear in another. That’s totally normal. It just shows how important it is to pick the time frame that best fits your trading style.
So, What is the Right Time Frame for You?
There’s no one “perfect” time frame for everyone. It depends on:
- How fast or slow do you like to trade
- How much time can you spend watching the market
- How much risk are you okay with
- Whether you like short-term action or long-term planning
You can try out different time frames and see which one feels right. Some people even mix different styles by using multiple time frames together.
Final Thoughts
Choosing the right traders time frame is a core part of developing a reliable, confident trading strategy. In case you enjoy rapid trading and picking up fast price movements, you can work with a low time interval, such as minutes.
If you like holding positions over very long time intervals and getting a sense of the big picture, a day, week, or even a month might be your best option.
We are all different. The most effective way to find out what works for you is to try out different time periods using a trading simulator (e.g., a demo account). In this way, you can learn without losing actual money.
Read More:
FAQs
1.How do I choose the right traders time frame for my strategy?
If you want simple and clear results, try using daily charts when you’re starting out. Over time, you can test shorter or longer time frames to see what gives you the best results.
2.Can I day trade using daily charts?
Yes, you can! Especially if you are new to trading, using daily charts is a smart place to start. They are easy to understand and help you avoid the stress of minute-by-minute changes.
3.Why should I trade using more than one time frame?
Using different time frames helps you make smarter choices. Also, using more than one time frame spreads out your trades, which can help lower your risk. If one trade goes wrong, another might go right, and that helps balance everything out.
4.What’s the role of a traders time frame in building consistency?
A well-matched traders time frame helps reduce noise, aligns with your decision-making speed, and improves long-term discipline.





4 Comments