


Bitcoin Liquidity Map Identifies $107K And $110,500 As Critical Short-Term Targets – Details

Bitcoin Liquidity Map Identifies $107K and $110,500 as Key Short-Term Price Levels
Summary: Bitcoin (BTC) remains in consolidation around $108,000 as traders watch for potential breakout or breakdown. New liquidity clusters at $107,000 and $110,500 identified by analysts are shaping near-term expectations for the cryptocurrency’s next major move.
Bitcoin Hovering Within Key Range
Bitcoin continues to trade within a tight consolidation band between $100,000 and $110,000, following a minor 0.33% gain in the past 24 hours. The leading cryptocurrency currently holds near $108,000, signaling a phase of indecision in the market.
The Imminent Bitcoin Battlefronts: $107,000 and $110,500
According to crypto market analyst Daan Crypto, liquidity data from Coinglass suggests critical price levels are now forming around $107,000 and $110,500. In a recent X post, the analyst noted that sharp liquidations occurred near $108,000 during Friday’s market activity, with positions now repositioning around the newly identified clusters.
The $107,000 region is acting as immediate support, as traders defend this level to avoid further liquidation. A drop below it could trigger a deeper sell-off toward $100,000. On the upside, $110,500 is seen as near-term resistance marked by potential short entries. A break and close above this level could trigger a short squeeze, potentially propelling Bitcoin beyond its all-time high of $111,970.
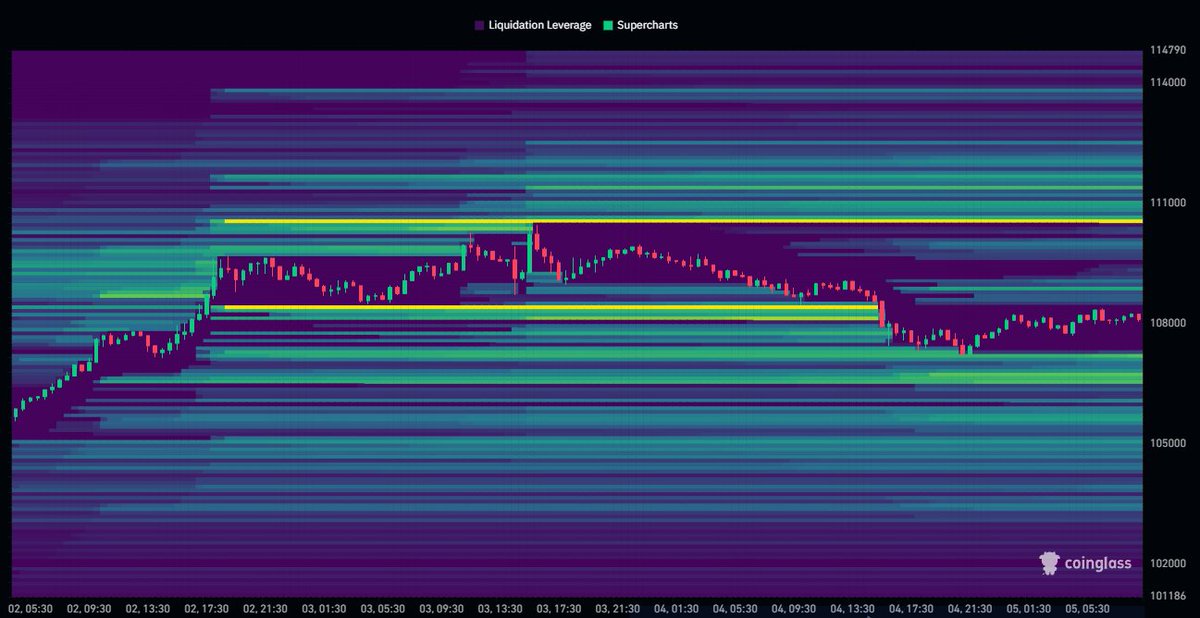
Overall, Bitcoin’s current price structure between $107,000 and $110,500 suggests a stabilization phase that may soon give way to a directional move.
Bitcoin Exchange Leverage Hits Record Levels
Amid the tightening liquidity clusters, market speculation appears to be intensifying. Data from CryptoQuant, shared by analyst Ali Martinez, shows that Bitcoin’s estimated leverage ratio across all exchanges has hit a new annual high of 0.27. This metric indicates a rise in borrowed capital usage, reflecting increased trader confidence—or risk appetite—in anticipation of significant volatility.
At the time of writing, Bitcoin trades at approximately $108,232, posting weekly and monthly gains of 0.70% and 6.41%, respectively. The cryptocurrency boasts a market capitalization of $2.15 trillion and maintains a dominant 64.6% share of the overall crypto market.
Outlook
With liquidity building up at both $107,000 and $110,500, Bitcoin’s next move could define its short-term trajectory. A decisive breakout could set the stage for a new price discovery phase, while a breakdown may return BTC to the lower end of its current trading range.


