

Crypto RSI Heatmap Explained (How To Use It Right)
")
The Crypto RSI Heatmap is a useful chart that traders use so that they can easily glance at what is happening in the crypto market. It indicates when a coin may be rising too quickly or dropping too far. This can assist you in determining the most opportune moment to buy or sell.
Here, we will tell you what RSI is and how the Crypto RSI Heatmap operates. We will also show how it can assist you in making wiser trading decisions.
What Is RSI (Relative Strength Index)?
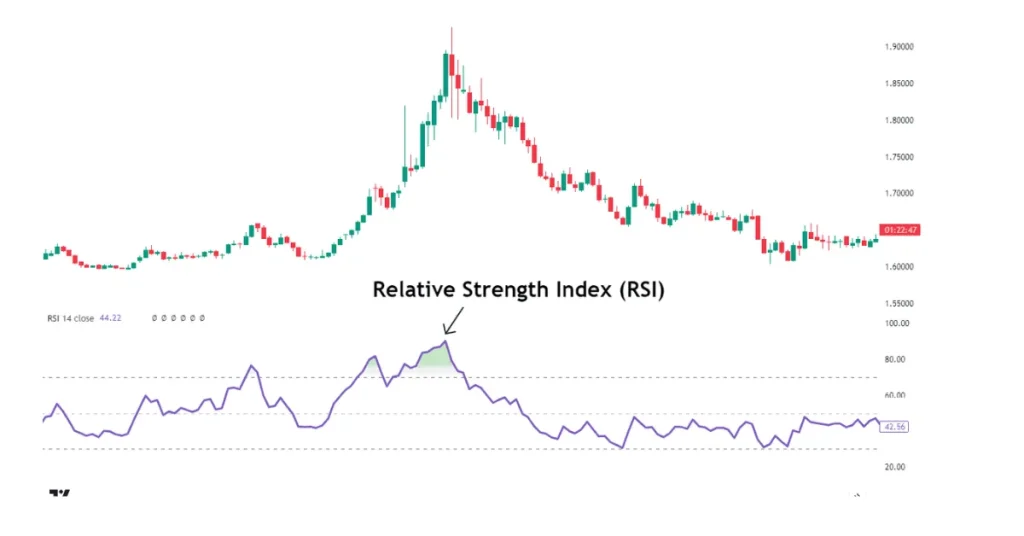
RSI stands for Relative Strength Index. It is a tool used to trade that will show the rate at which and how much a coin has moved recently. Imagine it like looking at the “energy level” of a coin. Is it rising too quickly? Or is it dropping too sharply?
The RSI is a number between 0 and 100.
When the figure is high, such as nearer to 100, it indicates plenty of buying has taken place – the coin could be overbought.
If the number is low, like closer to 0, it means there has been a lot of selling – the coin may be oversold.
So, RSI helps traders guess if the coin’s price might go down soon or start going up again.
Let us take Bitcoin as an Example.
Imagine you are looking at a Bitcoin chart. If you set it to show weekly candles, each candle shows the price change for one week.
The RSI will then compare:
- The average gains (weeks when Bitcoin went up)
- The average losses (weeks when Bitcoin went down)
Usually, traders look at the past 14 time periods (like 14 days or 14 weeks) to calculate the RSI. But you can also look at shorter or longer times if you want.
How to Read RSI Numbers
Here is what the numbers generally mean:
- RSI above 70 – The coin might be overbought. This means people have been buying it a lot, and the price may drop soon.
- RSI below 30 – The coin might be oversold. This means people have been selling it a lot, and the price may go up soon.
These signals are not always 100% right, but they give traders a clue about what might happen next.
How RSI Is Calculated (Made Simple)
The formula for RSI looks complicated, but here is the idea in simple words:
1. First, we look at the average gains over a set time (usually 14 days).
2. Then we look at the average losses in that same period.
3. We compare the two using this formula:
RSI = 100 – [100 ÷ (1 + RS)]
Where RS is the ratio of the average gain to the average loss.
Don’t worry if that still sounds tricky – most trading apps do the math for you!
What Is a Crypto RSI Heatmap?
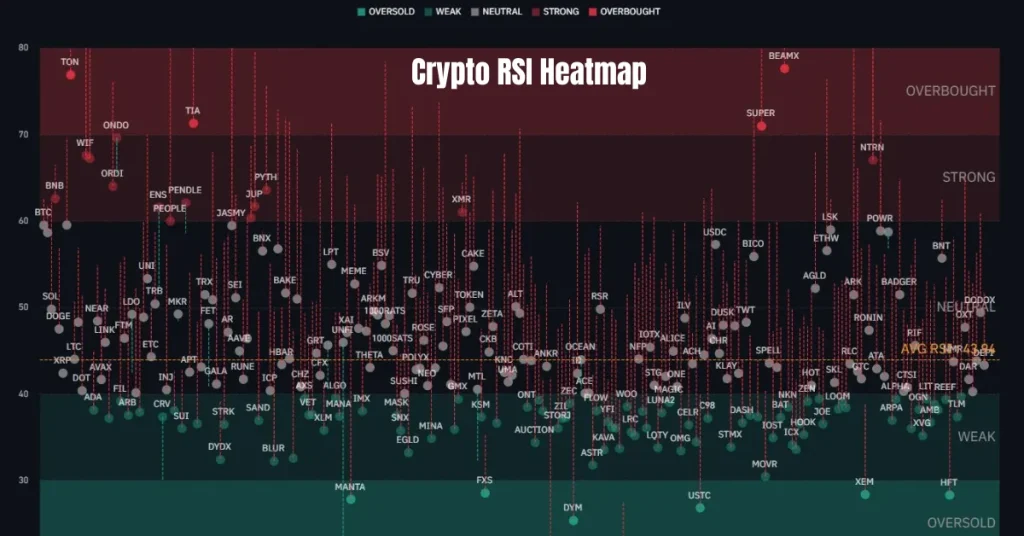
Now that you know what RSI is, let’s talk about the Crypto RSI Heatmap (also called the “Crypto Market RSI Heatmap” or “RSI Heatmap for Crypto).
This heatmap is a colorful chart that shows the RSI values for many cryptocurrencies at once. Instead of checking the RSI for each coin one by one, the Crypto RSI Heatmap helps you see everything in one place.
- Coins with high RSI (overbought) are usually shown in red or orange.
- Coins with low RSI (oversold) are often shown in blue or green.
- Coins in a normal range (between 30 and 70) might be yellow or light green.
It is like a weather map for crypto prices – you can quickly spot which coins might change direction soon.
Why Traders Use Crypto RSI Heatmaps
The Crypto RSI Heatmap helps traders:
- Save time by showing many coins at once
- Find trading opportunities more easily
- Decide when to buy (if a coin is oversold)
- Decide when to sell (if a coin is overbought)
It is especially helpful for people who trade often or watch many different coins.
How You Can Use the Crypto RSI Heatmap
Here are a few easy steps to start using the Crypto RSI Heatmap:
- Open the heatmap on a trading website or app that offers it.
- Look for coins with an RSI above 70 (might be ready to fall).
- Look for coins with an RSI below 30 (might be ready to rise).
- Check if the trend matches what you see on the price chart.
- Make your trading plan based on your research – do not trade just on one signal.
Key Features of the Crypto RSI Heatmap
The Crypto Market RSI Heatmap reveals the present and historical RSI values for more than 280 various cryptocurrencies. It is similar to a giant screen that assists you in viewing which coins are robust, weak, overbought, or oversold—all under one roof.
Here are the main zones you will see on the heatmap and what they mean:
- Weak Zone (40–30): This shows that a coin is starting to look weak, but it has not hit the oversold level yet. Traders keep an eye on this zone just in case it drops further.
- Oversold Zone (30–20): If a coin is in this zone, it means a lot of people have been selling it. But it could also mean the price might go back up soon. This is where some traders look for a buying chance.
- Strong Zone (60–70): Coins in this zone are gaining strength. The price is rising, but it hasn’t gone too high yet. Traders often watch closely when it gets near 70.
- Overbought Zone (70–80): This means a coin has been bought a lot, and the price might be too high. Some traders use this as a chance to sell or take profits before a drop.
How the Crypto RSI Heatmap Helps You Trade Smarter
The Crypto RSI Heatmap is super useful for traders because it saves time and shows important signals clearly. Here is how it helps:
- Spot Trading Opportunities Fast: Instead of checking one coin at a time, the heatmap shows you all the RSI data in one view. You can easily find which coins are getting close to overbought or oversold levels.
- Make Smarter Choices: Since the map uses colors and numbers to show price strength, it helps you decide when to buy, sell, or wait. You do not need to guess—you are using clear information.
- Understand the Market Better: By checking the RSI zones, you can learn more about what is happening in the market. Are most coins strong? Are many oversold? This helps you plan your next move better.
How to Use the Crypto RSI Heatmap in Your Trading Strategy
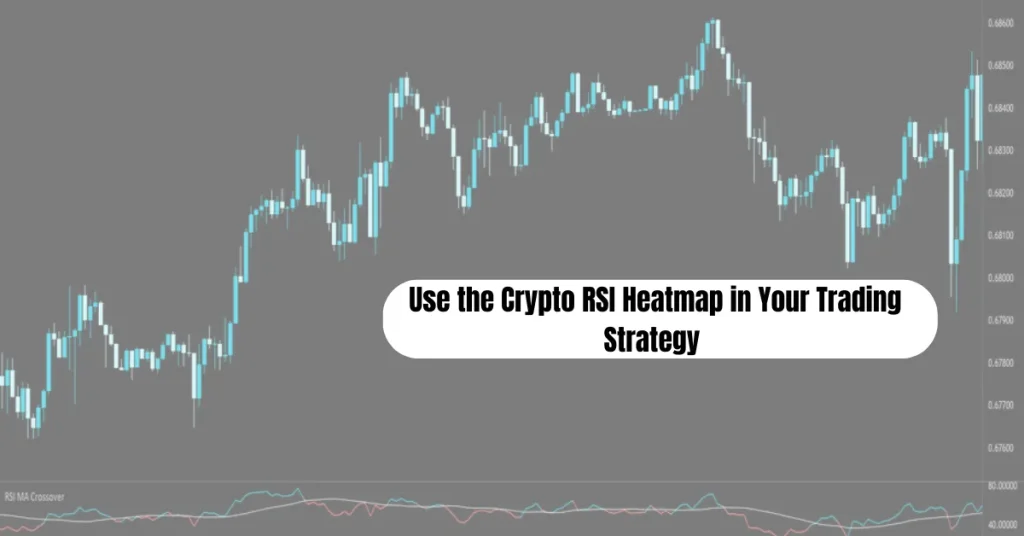
The Crypto RSI Heatmap can be a great tool to help you make smarter trading decisions. There are two main ways to use it in your strategy:
- Understand the Overall Crypto Market Mood: The first way to use the RSI Heatmap is to check the overall risk in the market. There is a yellow line on the heatmap that shows the average RSI of many coins. If this line goes above 70, it means the market is in what traders call an “overbought” zone. It signifies that a lot of coins are being purchased heavily, and prices may be higher than average. This is not necessarily going to result in prices falling immediately, but it may be time to consider taking some profit or being more cautious before purchasing more.
- Spot Coins That Might Be Good to Buy or Sell: The second way to use the Crypto RSI Heatmap is to look for specific coins or tokens that stand out. The heatmap lets you see the RSI levels of hundreds of coins all at once. This makes it easy to spot ones that might be going up or down fast, and you might find some that you did not even think about before.
Final Thoughts
Applying both the RSI and the Crypto RSI Heatmap (or “Crypto Market RSI Heatmap“) simultaneously is an excellent means of trading wiser in the world of crypto. RSI will inform you when a coin can be overbought or oversold. The heatmap goes a bit further by illustrating this information for numerous coins simultaneously, and it becomes incredibly easy to identify opportunities to buy low or sell high.
Read More:
FAQs
1.What does RSI stand for?
RSI means “Relative Strength Index.” It helps you see if a coin is being bought or sold too much.
2.What is a good RSI number to buy?
When RSI is below 30, it might mean the coin is oversold and could bounce back. This could be a good time to watch for buying opportunities.
3.What RSI number shows a coin is too high?
If the RSI is above 70, it may mean the coin is overbought. Some traders sell at this point before the price drops.
4.Is the Crypto RSI Heatmap hard to use?
Not at all. It is made to be easy to read. With colors and clear zones, you can quickly see which coins are strong or weak.
5.Can I use the Crypto RSI Heatmap for short-term trades?
Yes! You can use it for both short-term and long-term trades. Just change the time frame (like 1 hour, 1 day, or 1 week) depending on how you trade.


3 Comments